
Rapid Review·Cardiovascular
Select any text to highlight it or add a note.
Foundations
T2High yieldECG Basics
Videos
1 to play here
Play 1 here
Focus on
Read every ECG in the same order — rate → rhythm → axis → intervals → QRS → ST/T — then pattern-match: territory by leads, electrolyte signatures, pericarditis vs STEMI, tamponade, PE. Rhythm-by-rhythm diagnosis and treatment live on the arrhythmia pages.
Key takeaways
Conduction system and what feeds it
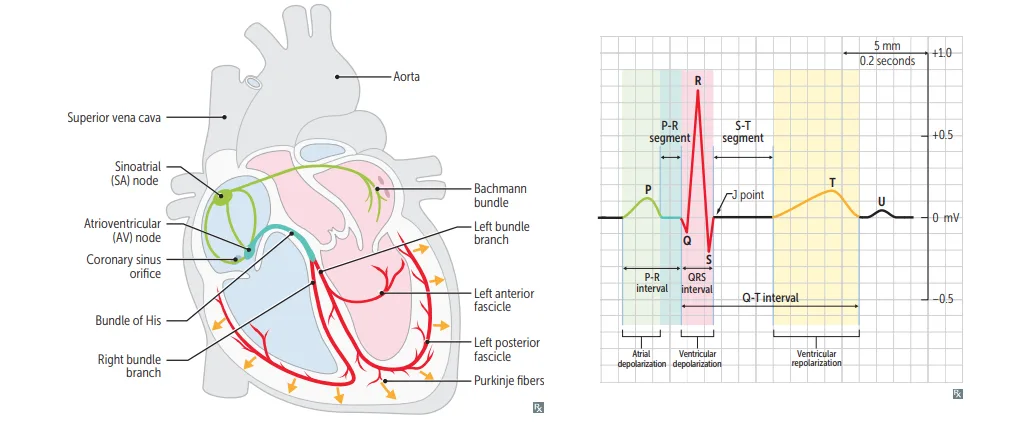
What this shows
The pathway runs in one direction
traced on the conduction pathway and electrocardiogram (ECG) complex figure.- Sinoatrial (SA) node: upper crista terminalis, near the superior vena cava (SVC).
- Atria: the impulse spreads across both atria.
- Atrioventricular (AV) node: interatrial septum, near the coronary sinus.
- Bundle of His: carries it into the septum.
- Right and left bundle branches: the left splits into anterior and posterior fascicles.
- Purkinje fibers: spread it through the ventricles.
The AV node's ~100 ms delay lets the ventricles fill
atria and ventricles should not contract together.- When they contract independently (AV dissociation) the atrium hits a closed tricuspid valve, giving cannon a waves (Jugular Venous Pressure).
Both nodes are usually supplied by the right coronary artery (RCA)
so inferior myocardial infarction (MI) brings sinus bradycardia and AV block.Two orderings that get confused
one is who fires fastest, the other who conducts fastest.- Pacemaker rate: SA > AV > His/Purkinje/ventricle.
- Conduction speed: His-Purkinje > atria > ventricles > AV node (slowest to conduct, not slowest to fire).
Waves and intervals
P wave
atrial depolarization (best in lead II).PR interval
120 to 200 ms (the whole interval, not the PR segment).- > 200 ms = first-degree block.
- Short + delta wave = pre-excitation.
QRS
< 100 to 120 ms.- Wide = ventricular origin, bundle branch block, pacing, pre-excitation, hyperkalemia or sodium-channel-blocker toxicity.
J point, ST, T
J point = end of QRS; ST segment isoelectric; T wave = ventricular repolarization.QTc
< ~450 to 460 ms and less than half the R-R.U wave
late repolarization, prominent in hypokalemia and bradycardia (best seen in V2 to V4).| Component | Represents | Normal / abnormal |
|---|---|---|
| P wave | Atrial depolarization | Absent in atrial fibrillation (AF); sawtooth in flutter; ≥ 3 shapes in multifocal atrial tachycardia (MAT) |
| PR interval | Atrial to ventricular activation | 120 to 200 ms; long = AV block; short = Wolff-Parkinson-White (WPW) |
| QRS | Ventricular depolarization | < 120 ms; wide = bundle branch block (BBB), ventricular rhythm, hyperkalemia, tricyclic antidepressant (TCA)/class IC toxicity |
| ST segment | Plateau, ventricles depolarized | Elevation ≥ 1 mm limb / ≥ 2 mm precordial; depression ≥ 0.5 to 1 mm |
| T wave | Ventricular repolarization | Peaked = hyperkalemia or hyperacute ischemia; flat = hypokalemia; inverted = nonspecific / ischemia |
| QT interval | Depolarization + repolarization | Long = torsades risk (drugs, low K/Mg/Ca, congenital) |
| U wave | Late repolarization | Hypokalemia, bradycardia |
The systematic read
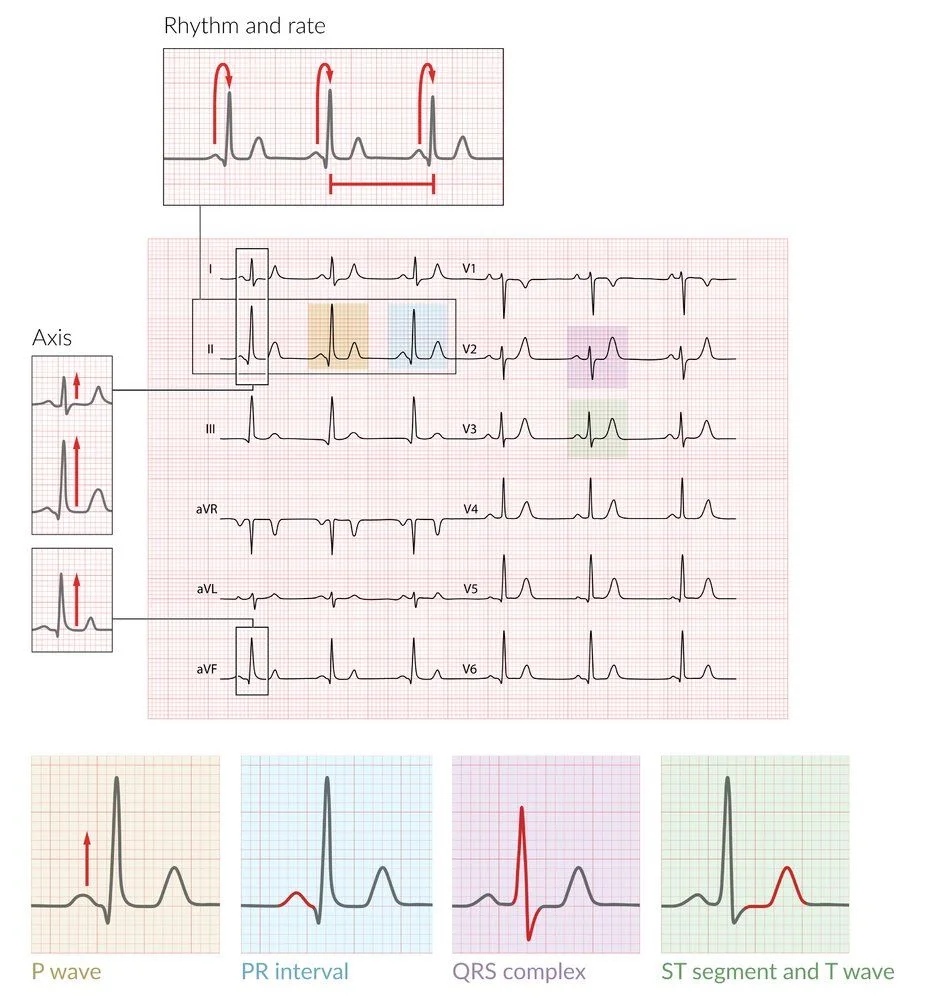
What this shows
Calibration
confirm 10 mm/mV and 25 mm/s.Rate
regular rhythm, 300 ÷ large boxes between R waves (300, 150, 100, 75, 60, 50); irregular rhythm, QRS count on a 10-s strip × 6, as on the Calculate regular and irregular ECG rates. Over 100 is tachycardia, 60 to 100 normal, under 60 bradycardia.Rhythm
are there P waves (atrial rhythm)? Are they normal and all alike (sinus, single focus)? One P per QRS (no AV dissociation)? R-R regular or irregular?Axis
from leads I and aVF (details below).Intervals
PR, QRS, QT.QRS morphology
pathologic Q waves, poor R-wave progression, voltage criteria for left ventricular hypertrophy (LVH).ST/T
in every lead, then U waves.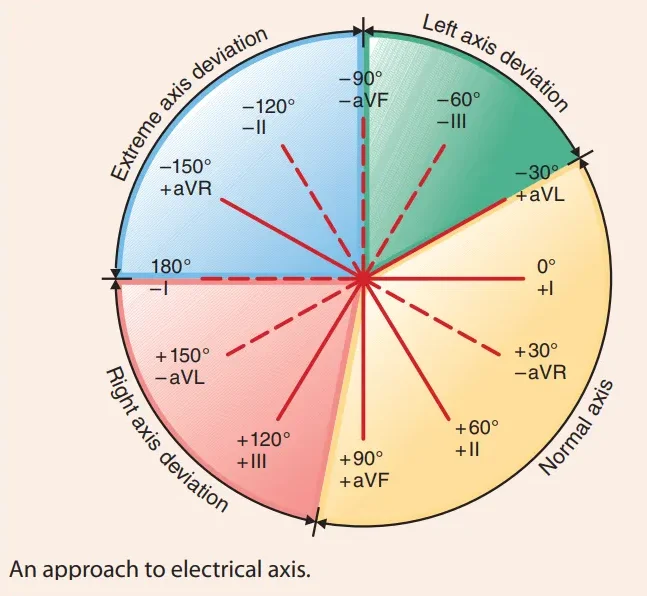
What this shows
Axis from leads I and aVF
normal is -30° to +90°.- Both positive: normal.
- I positive and aVF negative: check lead II; negative = left axis deviation (LVH, left bundle branch block (LBBB), inferior MI, left anterior fascicular block).
- I negative and aVF positive: right axis deviation (right ventricular hypertrophy (RVH), pulmonary embolism (PE), lateral MI, left posterior fascicular block).
- Both negative: extreme axis.
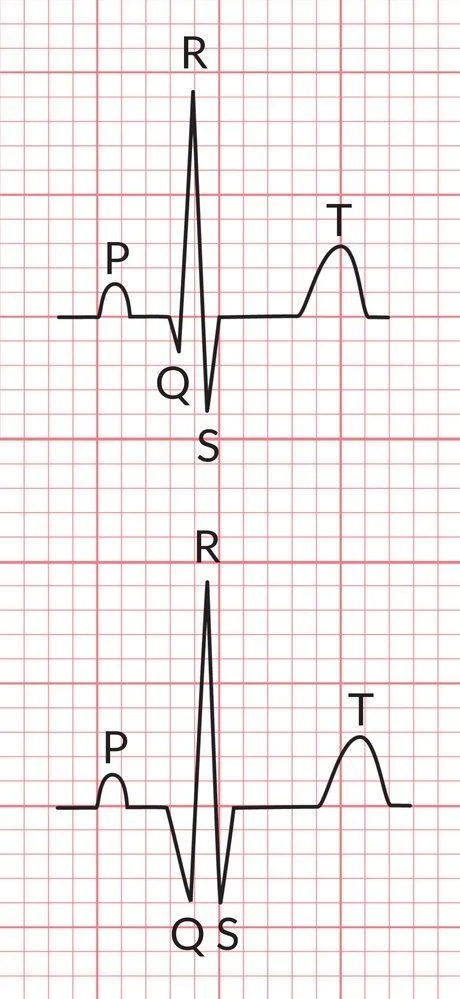
What this shows
Pathologic Q waves
≥ 40 ms wide and ≥ 25% of the R wave (or deeper than 0.2 mV), or any Q in V1 to V3.QRS width tells the origin
over 100 ms suggests a ventricular rhythm or bundle branch block; under 100 ms a supraventricular (atrial or AV nodal) rhythm.Narrow-complex rhythms
the Map the common supraventricular rhythms shows where each narrow-complex rhythm starts; the rhythm pages take it from there.Ischemia and infarct localization
Evolution
four stages in order.- Hyperacute (peaked) T waves.
- ST elevation.
- T-wave inversion and loss of R waves.
- Pathologic Q waves.
- Reciprocal ST depression in the opposite wall supports ST-elevation MI (STEMI) over pericarditis.
Posterior MI hides
as ST depression with tall R waves in V1 to V3; confirm with V7 to V9.Inferior MI with hypotension
get right-sided leads (V4R) for right ventricular infarction.- Both on Acute Coronary Syndrome.
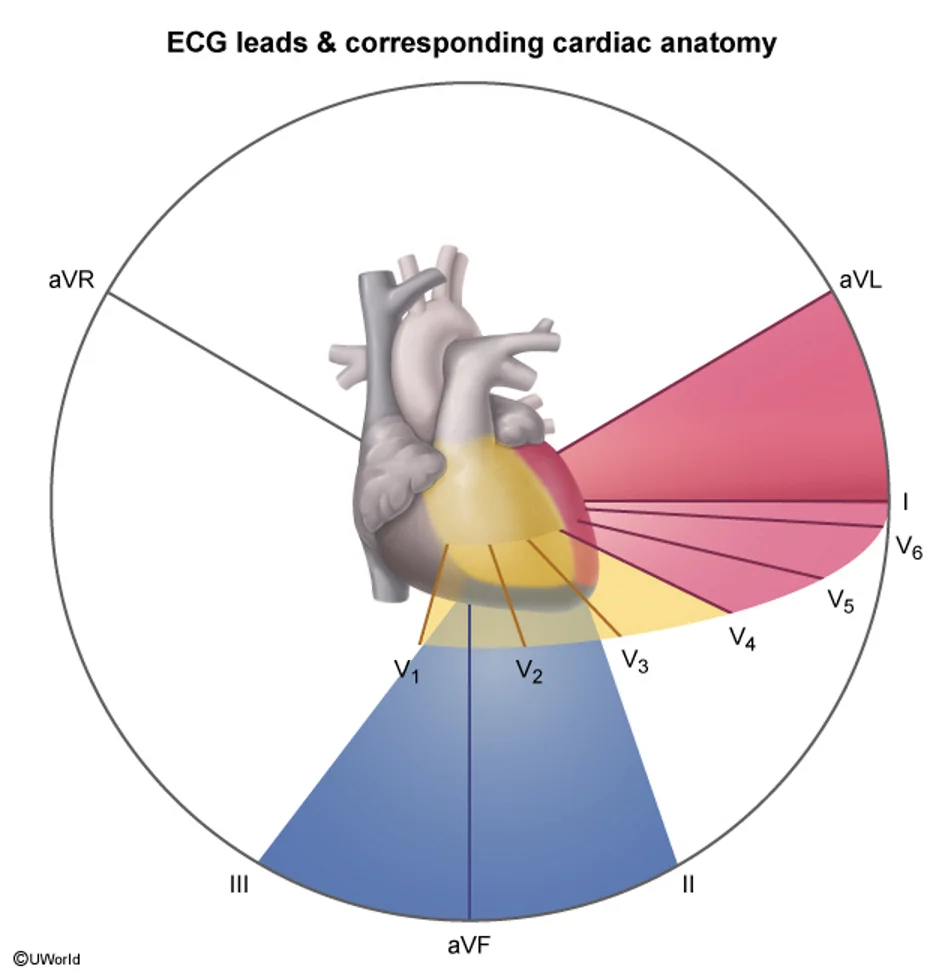
What this shows
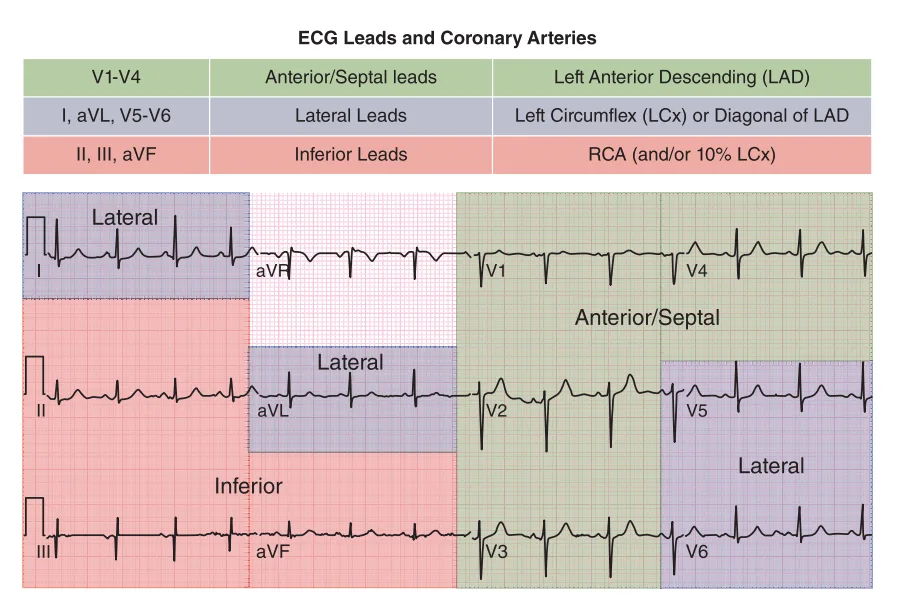
What this shows
| Territory | Leads with ST elevation | Usual artery |
|---|---|---|
| Septal | V1 to V2 | Proximal left anterior descending artery (LAD) |
| Anterior | V3 to V4 | LAD |
| Lateral | I, aVL, V5 to V6 | Left circumflex artery (LCX) or diagonal |
| Inferior | II, III, aVF | RCA (~80%), LCX |
| Posterior | ST depression V1 to V3, tall R; elevation V7 to V9 | RCA or LCX |
| Right ventricle | V4R (with inferior MI) | Proximal RCA |
Pattern recognition beyond the coronaries
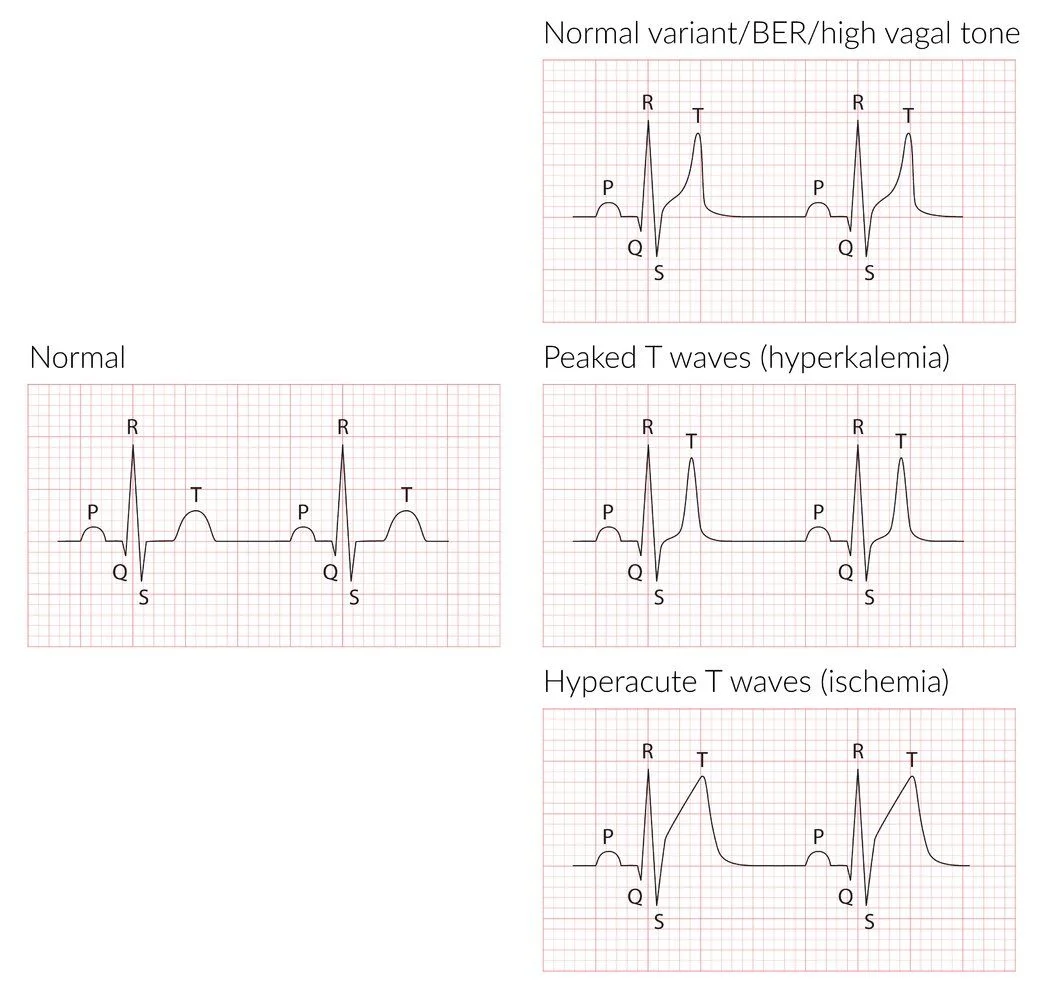
What this shows
Electrolytes and temperature
each has a signature.- Hyperkalemia: peaked T, then widened QRS, then sine wave (give calcium).
- Hypokalemia: flat T + U wave.
- Long QT: hypocalcemia, hypokalemia, hypomagnesemia.
- Short QT: hypercalcemia.
- Osborn (J) wave: a positive deflection at the J point in hypothermia.
Digoxin
scooped "reverse-tick" ST depression at therapeutic levels, as on the reverse-tick ST depression.- Toxicity brings any arrhythmia, classically atrial tachycardia with block (Digoxin Toxicity).
| ECG | Diagnosis | Clinical picture |
|---|---|---|
| Regional ST elevation with reciprocal depression, evolving Q waves | Acute Coronary Syndrome (STEMI) | Crushing retrosternal pain, diaphoresis, new S4 |
| Diffuse concave ST elevation + PR depression, no reciprocal change (except aVR) | Acute Pericarditis | Pleuritic pain better sitting forward, friction rub |
| Sinus tachycardia, low voltage, electrical alternans | Cardiac Tamponade | Beck triad, pulsus paradoxus |
| LVH with deep narrow septal Q waves in inferior/lateral leads | Hypertrophic Cardiomyopathy | Young athlete with syncope or murmur that grows on standing |
| Low voltage despite thick walls on echo, conduction disease | Restrictive Cardiomyopathy (amyloid) | Right-sided failure, proteinuria, neuropathy |
| Sinus tachycardia (most common), S1Q3T3, new right bundle branch block (RBBB), right axis | Pulmonary embolism | Sudden pleuritic dyspnea, hypoxemia |
| Sawtooth flutter waves at ~300/min, often 2:1 (rate 150) | Atrial Flutter | Regular narrow tachycardia at exactly 150 |
| Coved ST elevation V1 to V3 with RBBB pattern | Brugada Syndrome | Syncope or family history of sudden death, Southeast Asian men |
| Short PR, delta wave, wide QRS | Wolff-Parkinson-White Syndrome | Palpitations; pre-excited AF |
Bundle branch blocks
look at V1 with a QRS ≥ 120 ms.- An upright terminal deflection (RSR′) is RBBB.
- A dominant negative deflection is LBBB.
- A new LBBB with ischemic symptoms rules in a STEMI even without ST elevation, and goes to urgent reperfusion. Details and clinical meaning on Bundle Branch Block.
A dialysis patient who missed a session has peaked T waves and a QRS that is starting to widen. What is the next step, and why that first?
Hyperkalemia, moving along the sequence peaked T, then wide QRS, then sine wave. Give intravenous (IV) calcium first: it stabilizes the cardiac membrane immediately, before insulin, glucose and dialysis lower the potassium.
How it's tested
Diffuse ST elevation with PR depression in a young man with sharp pain relieved by sitting up: pericarditis, not STEMI — no reciprocal changes, no regional pattern.
Peaked T waves and a widening QRS in a dialysis patient who missed a session: hyperkalemia — IV calcium first to stabilize the membrane, then insulin/glucose and dialysis.
ST elevation in II, III, aVF with hypotension and clear lungs: get V4R; RV infarction is preload-dependent — fluids, no nitrates.
Regular narrow tachycardia at exactly 150 with a sawtooth baseline in II: atrial flutter with 2:1 block.
An ECG with a positive deflection at the J point in a hypothermic patient: Osborn wave — rewarm, handle gently.
Go deeper
Guidelines: 2025 AHA Adult Advanced Life Support Guidance
Related Step 2 pages: Bundle Branch Block, Approach to Tachyarrhythmias, Ventricular Tachycardia, Atrioventricular Block, Acute Coronary Syndrome, Cardiac Anatomy
High-yield images10
You just read one page of 236
The rest of Step 2 CK, written exactly like this.
Rapid Review is the reading layer of a full Step 1 platform: a schedule fitted to your exam date, flashcards for every page, and a mentor a message away.
Every Step 1 system
Written the same way: what to know, how it’s tested, where to go deeper.
A plan built to your exam date
Tell us when you sit, and the schedule fits the whole library and your question bank to it.
Flashcards for every page
Ready-made spaced-repetition decks linked to each topic, so nothing you read gets forgotten.
